

Why Value? | Financial Services | ONE+ONE Wealth ManagementWhy Value?
Why Value?
Welcome to the third installment of our "Why Series?". This piece will address the question, "Why Value?". At One + One Wealth Management, we believe that Value stock exposure (and not Growth/Tech stock exposure) should play an important role in clients' portfolios for the next 3-5 years for several reasons:
1) Value stocks are historically cheap in both absolute terms and relative to Growth/Tech stocks. This represents an opportunity for well above-average rates of return in an environment where the S&P500 is historically expensive and priced to deliver below-average rates of return.
2) As we showed in “Why Commodities?” we believe the cycle higher in Commodity prices has just commenced and is set to rise for the good part of the next 10+ years. This translates into higher-than-average inflation. Value stocks have historically outperformed with this type of market backdrop.
Any discussion of Value stocks begins with what are Value stocks and what are Growth stocks? Why should I care about the difference, and why wouldn’t I just buy stocks like Apple?
Here are a few key charts that help illustrate where we are in the Value vs Growth stock cycle and why we feel there is significant upside for Value-based investments.
Illustration #1:
This chart illustrates that Value stocks have a strong tendency to outperform Growth/Tech stocks over time. By an average of +4.4% per year from 1927-2022. This explains why Warren Buffett is a Value investor. However, we saw a significant deviation from this long-term trend from 2008-2021 whereby Growth stocks trounced Value stocks. Why was that? It can be explained by Zero Interest Rate Policy by the Federal Reserve (ZIRP). 0% interest rates allowed for expensively priced Growth stocks to become even more expensively priced – a bubble if you will. This aberration swiftly reverted to Value when interest rates surged from their longstanding 0% level, starting in 2021 and continuing through 2022 to the present day. This shift resulted in robust Value outperformance in 2022.
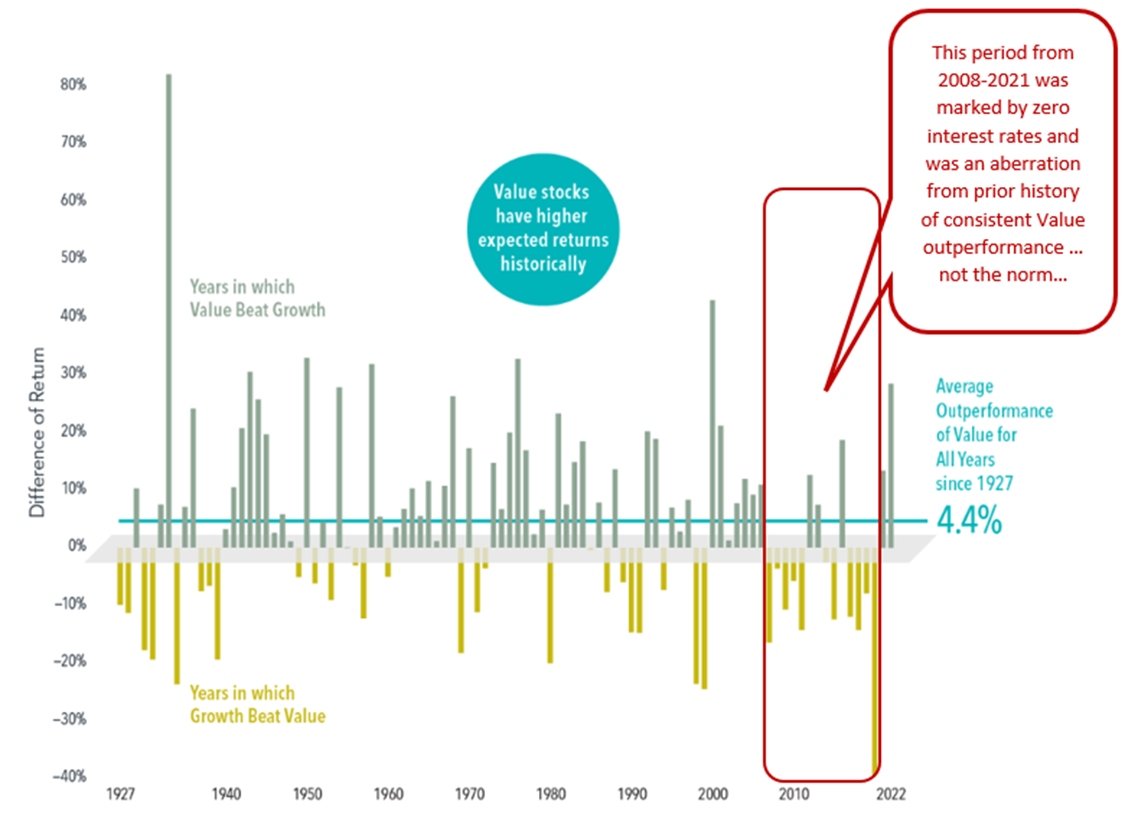
Source: Fama/French Indices & Brandes Investment Partners
Illustration #2:
Here's another perspective on the previous chart. Instead of bars representing individual years, this chart displays a continuous return line. It illustrates the relative performance of Growth versus Value. When the line trends south, it indicates Growth underperformance and Value outperformance. As you can observe from the chart, this is the typical pattern with occasional spikes showing periods of Growth outperforming briefly. The period from 2008 to 2021 stands as an extended aberration from the normal return history. The only other significant aberration occurred from 1994 to 2000 when Value struggled as investors flocked to Tech and Internet stocks. When the Tech/Internet bubble burst in 2000, it ushered in over seven years of strong Value outperformance.
Illustration #3:
Value stocks are exceptionally undervalued when considering the past 30+ years. The last two instances of pronounced undervaluation occurred in early 2000 at the peak of the Tech/Internet Bubble and in early 2009 following the Great Financial Crisis. The performance of Value versus Growth stocks tends to fluctuate in sync with the inflation/commodity cycle. Given the lack of attention Value stocks received from 2008 to 2021, they are significantly underrepresented in investors' portfolios and historically undervalued. This combination sets the stage for substantial outperformance by Value stocks in the next 3-5 years or even longer, until valuations normalize in relation to Growth stocks. The upcoming illustration will depict the immediate opportunity at hand.
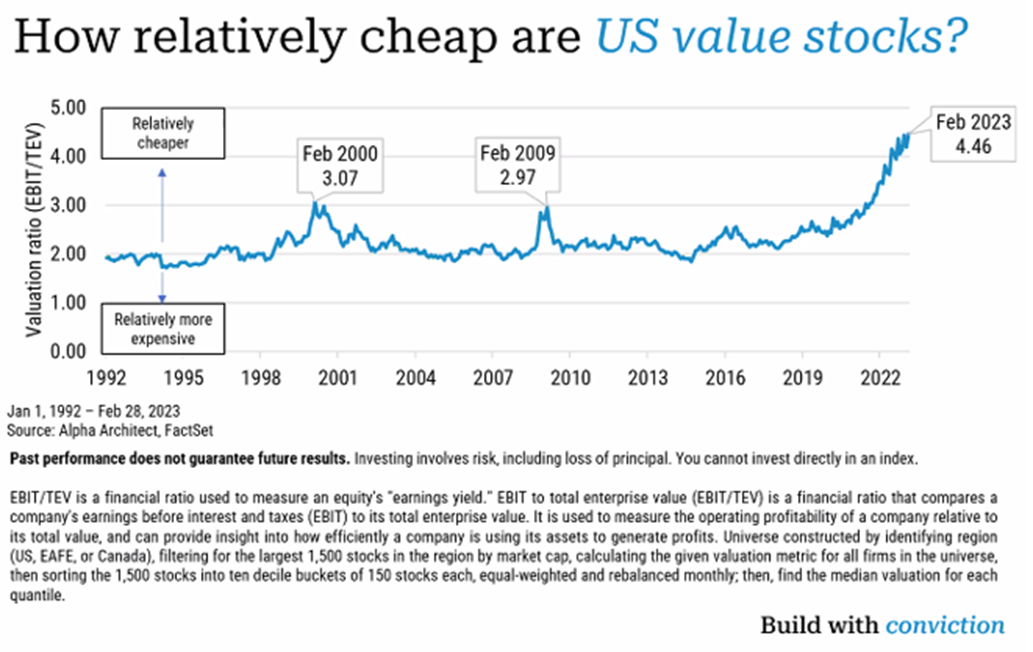
Illustration #4:
The current overvaluation of the S&P 500, following robust stock market gains since early 2009, sets the stage for well-below-average returns for the broader stock market in the future. This doesn’t mean there are no opportunities available for investors to earn average or above-average stock returns, you just simply have to look in the right places.
Given the extreme cheapness of Value stocks shown in illustration #3, the table below demonstrates the returns observed in the extremely cheap segment of the market after the peak of the Tech/Internet Bubble from January 2000 to December 2004. The market, due to its over-valuation, delivered an annualized return of -2.30% per annum for five years post-bubble. In contrast, Value stocks, as defined by Total Enterprise Value to EBIT, delivered +27.66% per annum! And as we’ve shown, the current valuation is even more extreme than what was seen before.
Investors focused on chasing the prior cycle winners (FANG stocks, MegaCap Growth/Tech stocks, and the S&P 500 index) are using the wrong playbook. The current playbook urges investors to avoid the last cycle’s winners and focus on the extraordinarily undervalued stocks within the Value segment. This is where our focus lies.
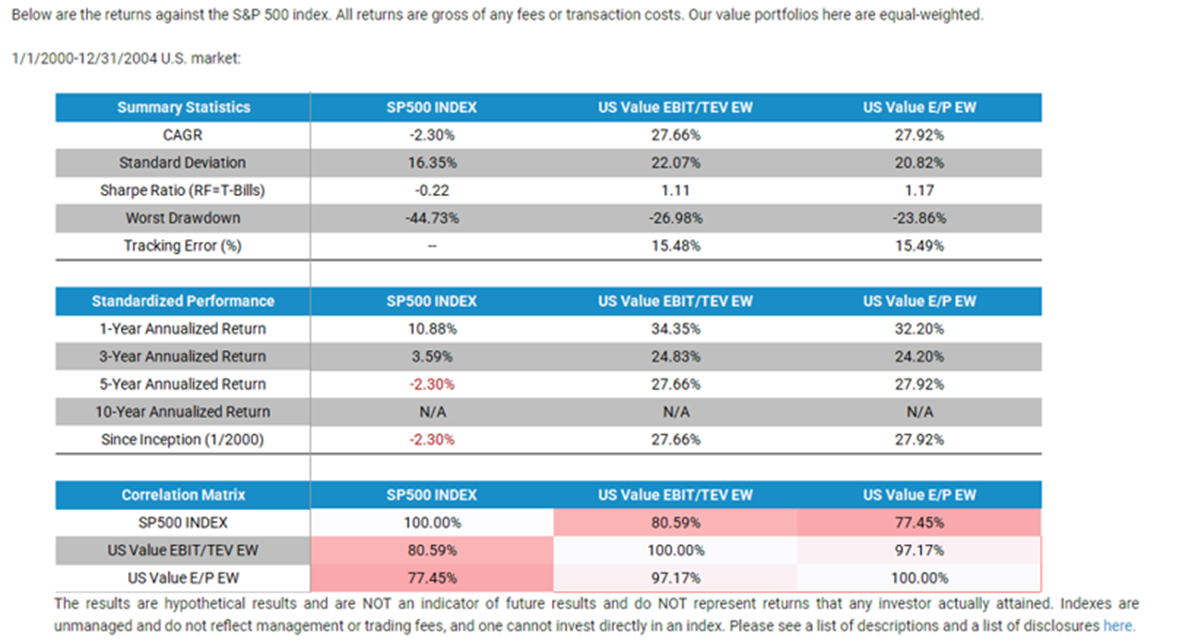
Source: AlphaArchitect
Illustration #5:
The cheapness of Value relative to Growth is not a characteristic found in US stocks alone. The same extreme cheapness exists in non-US markets as well. Value stocks in non-US markets are also trading at extreme levels last seen at the peak of the Tech/Internet Bubble in early 2000.
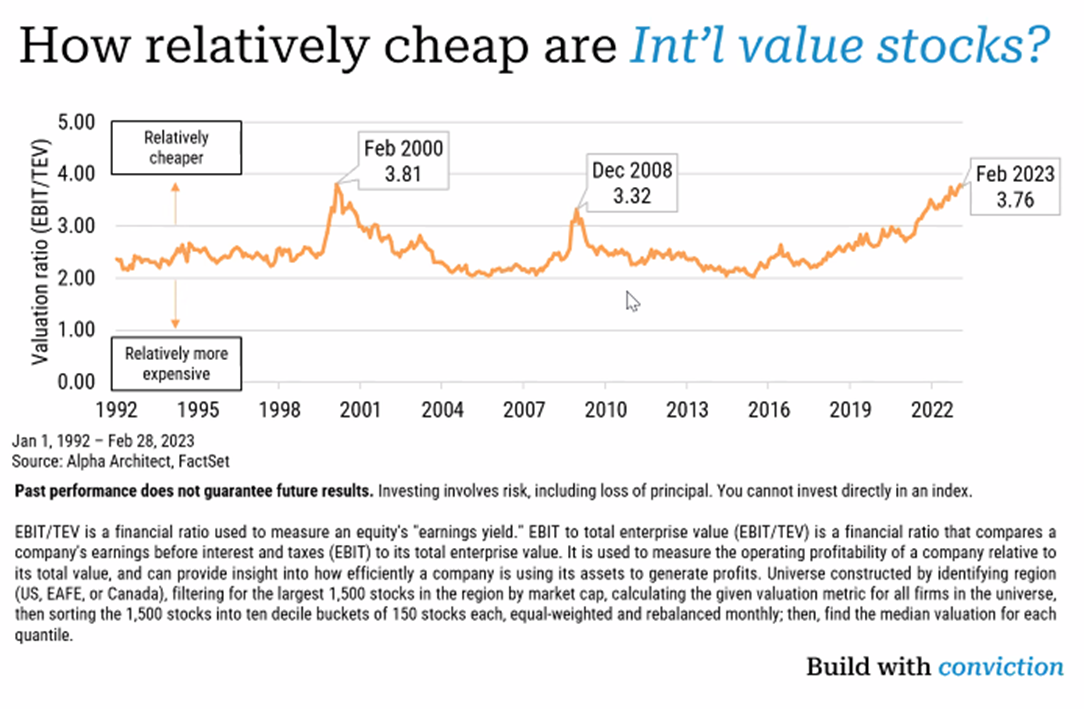
Illustration #6:
This next chart is a re-hash from our Why Commodities? piece. It shows the close correlation between Commodity price returns and Value stocks versus Growth stocks. It’s just the cycle…. When commodity prices are rising/outperforming that is associated with Value stocks outperforming Growth stocks and vice versa. We believe the cycle favoring Commodities, and hence Value over Growth, commenced in 2020. These cycles typically last 15 years up followed by 15 years down for Commodities. This means there is still are many years left before the current upcycle is exhausted. These commodity cycles last this long because that is how long it takes before overinvestment and oversupply enter the arena and apply downward pressure to commodity prices.
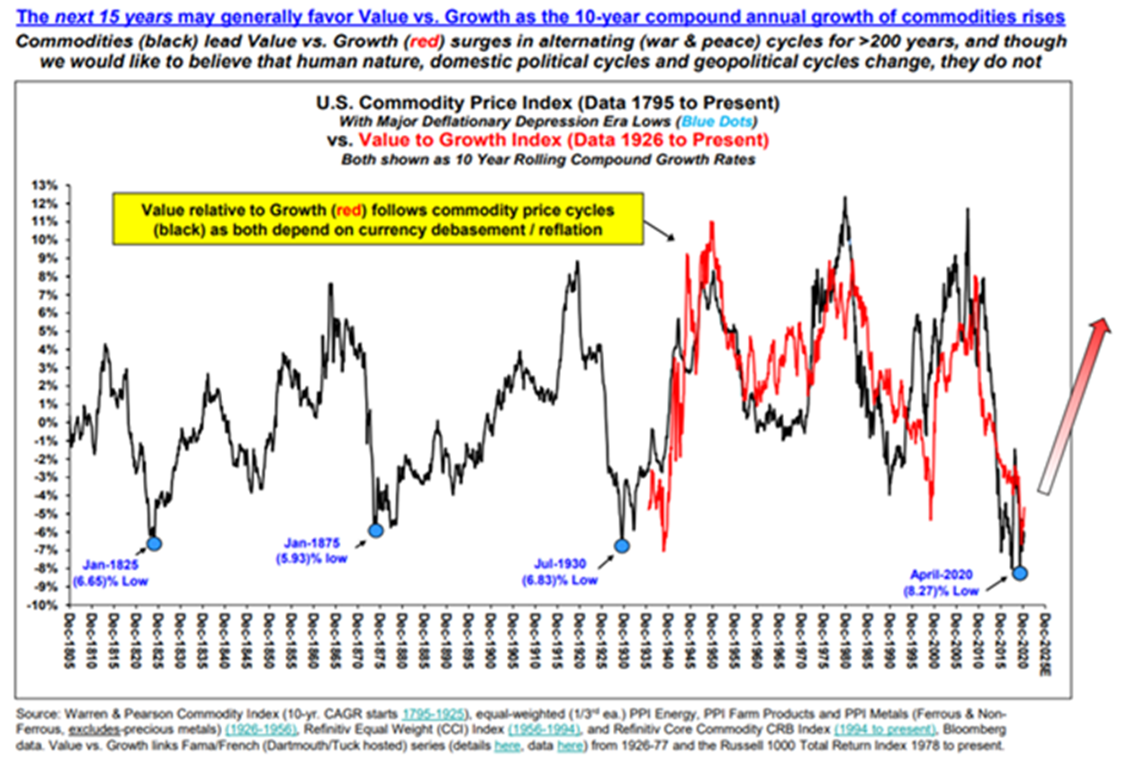
Illustration #7:
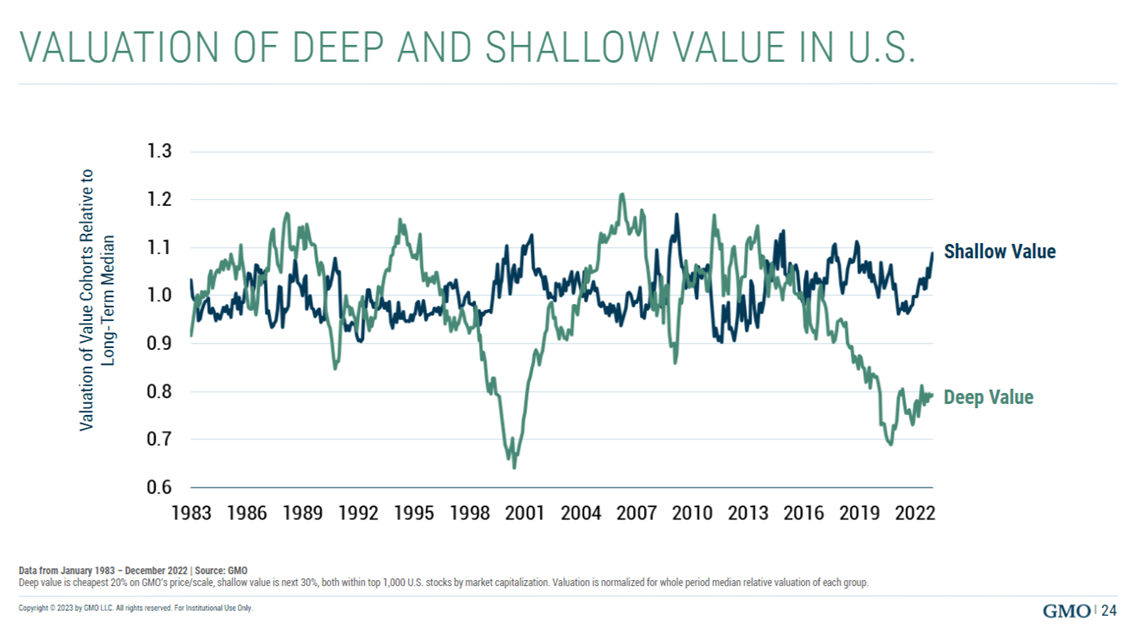
Lastly, what you own in the Value space matters tremendously. As you can see below, Value can be split into “Shallow Value” and “Deep Value”. Shallow Value are stocks characterized as “Value” by major indexes like iShares, SPDR and S&P. However, these Shallow Value holdings have very little “value exposure” and are currently expensive relative to their history. “Deep Value” holdings are historically cheap and exhibit the same valuation characteristics which generated the tremendous outperformance following the 2000 Tech/Internet Bubble. This is the area we are focused on. You don’t want to own cheap, passive Value investments. Rather you want access to managers who are actively searching for the Deep Value characteristics capable of delivering strong returns. These are the managers we include in our client’s portfolios. The type of Value you own matters tremendously.
We are bullish on Value stocks (not Growth and Tech), Commodities, Precious Metals and Energy in general. Stay tuned for our next “Why Series?” blog post covering “Why Gold & Silver?”. As always, please contact us to learn more and how we can help navigate and optimize your portfolios during today's market chaos. Additionally, let us know of specific topics of interest you'd like us to address.
Information presented is believed to be factual and up to date, but we do not guarantee its accuracy and it should not be regarded as a complete analysis of the subjects discussed. All expressions of opinion reflect the judgment of the authors as of the date of publication and are subject to change. Information on this website does not involve the rendering of personalized investment advice but is limited to the dissemination of general information on products and services. A professional adviser should be consulted before implementing any of the strategies presented. Content should not be construed as an offer to buy or sell, or a solicitation of any offer to buy or sell the securities mentioned herein. Hyperlinks on this website are provided as a convenience and we disclaim any responsibility for information, services or products found on websites linked hereto. One + One Wealth Management is registered as an investment adviser with the SEC and only transacts business in states where it is properly registered or is excluded or exempted from registration requirements. Registration as an investment adviser does not constitute an endorsement of the firm by securities regulators nor does it indicate that the adviser has attained a particular level of skill or ability.
Any tax and estate planning information provided is general in nature and should not be construed as legal or tax advice. Always consult an attorney or tax professional regarding your specific legal or tax situation. All investment strategies have the potential for profit or loss. Different types of investments involve varying degrees of risk, and there can be no assurance that any specific investment or strategy will be suitable or profitable for a client's investment portfolio.