

Why Commodities
Why Commodities?
Welcome to the second installment of our "Why Series?" This piece will address the question, "Why Commodities?"
At One + One Wealth Management, we believe that commodity exposure should play an important role in clients' portfolios for two main reasons: 1) to hedge against higher-than-average inflation and 2) to provide returns above those that we believe can be achieved with traditional stock market exposure.
Any discussion of commodities as investments begins with the cyclical nature of commodity prices. Commodities tend to cycle up and down. Up cycles are triggered when scarcity and underinvestment collide with rising demand. When demand for commodities exceeds supply, it drives commodity prices higher. Higher commodity prices tend to attract new capital investment, which increases the overall supply of commodities. When the overall supply of commodities exceeds the demand, then prices naturally decline. This cycle is why the commodities markets operate under the general rule of thumb that "The best cure for high prices is high prices."
We believe that we are currently in a cyclical sweet spot for commodities. We have experienced significant underinvestment, which limits supply, while demand is accelerating globally as economies recover from the COVID-driven economic slowdowns.
Here are a few key illustrations that help exemplify where we are in the commodity cycle and why we feel there is significant upside for commodity-based investments.
Illustration #1:
This chart illustrates that 10-year rolling returns for commodities tend to follow 30-year cycles, give or take a few years. These cycles typically consist of 15-year upcycles followed by 15-year downcycles. With the current cycle underway since the 2020 COVID lows, we anticipate an upward trend until mid to late 2030’s, marking the next peak in commodity prices and the subsequent down leg.
These commodity cycles represent the pure manifestation of supply and demand. Commodities experience upward cycles when excessive demand intersects with insufficient supply. Peaks in commodity cycles occur when over-investment and surplus supply inundate the market, leading to price declines or collapses. Bottoms of commodity cycles occur when capital investment is lacking or scarce, and demand begins to rise for the inadequately supplied commodities.
We believe that we are now 2 ½ years into the next cyclical 15-year advancement for commodity prices. This holds significant implications for the bonds and stocks within portfolios. Higher commodity prices often correlate with higher inflation, which is bad for both stock and bond returns relative to historical averages.
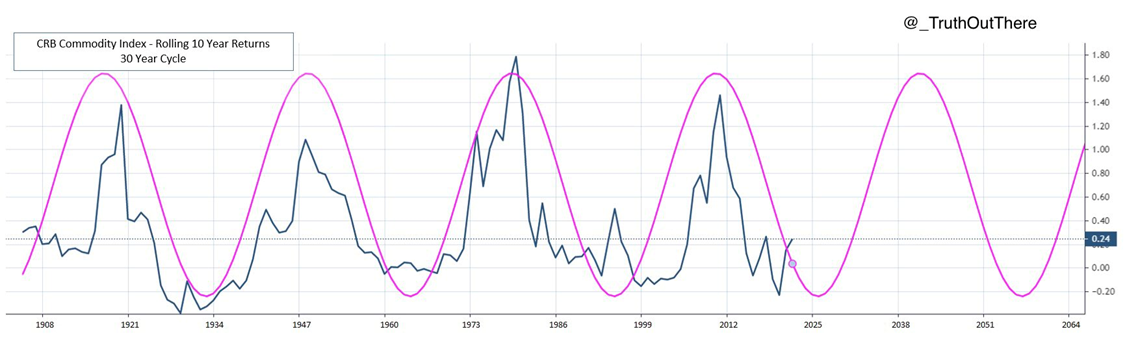
Illustration #2:
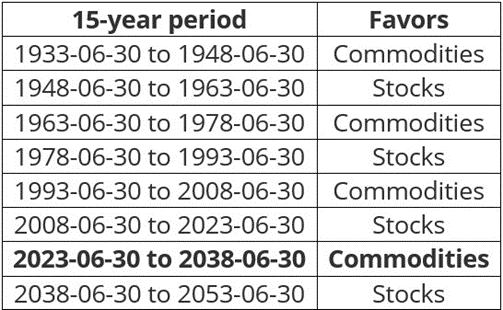
The returns of stocks and commodities during these 15-year up and down cycles are quite clear. During upcycles for commodities, they tend to significantly outperform stocks. And during downcycles for commodities, stocks tend to significantly outperform commodities. These asset classes tend to exhibit a 'negative correlation,' which simply means their return streams are not strongly correlated with each other, making them good asset classes to hedge against one another. In other words, when stocks perform poorly, commodities tend to perform well, and vice versa. Looking back at the past 90 years of stock and commodity performance, the cycle works as follows:
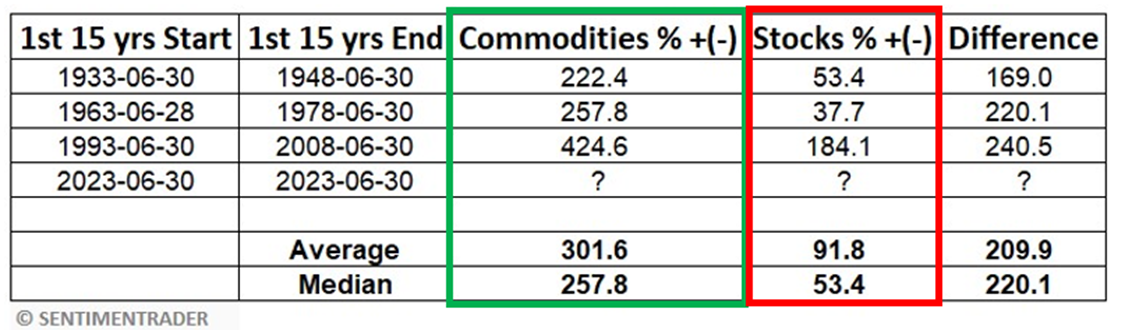
And the returns associated with the commodity up-cycles look like this. Commodities handily outperform stocks during commodity up-cycles:
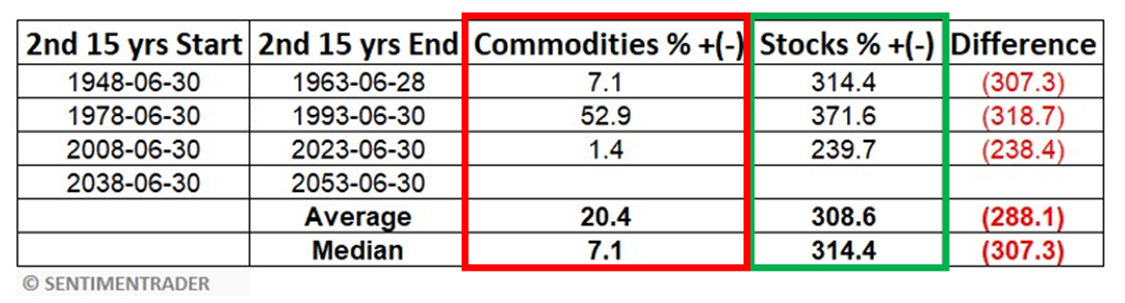
And the returns during the commodity down-cycles look like this. Stocks handily outperform commodities during commodity down-cycles:
Our analysis of investment surveys reveals a current record under-allocation to commodities. This, in our view, signifies significant potential momentum to propel commodity prices higher.
Illustration #3:
Many investors have concluded that the robust two-year rally in commodities from March 2020 to June 2022 marked the culmination of the trend. However, considering the historical 30-year cycle for commodities, this two-year surge is merely an initial upward movement, likely to be followed by another phase of growth. Our analysis suggests that next leg higher may have commenced at the most recent commodity low in June 2023.
We also anticipate commodities to outperform stocks, as indicated in the upper section of the chart. The ratio displayed in the top section demonstrates the relationship between commodities and the S&P 500 index. A rising line signifies commodities outperforming stocks, while a declining line represents stocks outperforming commodities. We hold the view that the recent rally in the S&P 500 during 2023, following the challenging year of 2022, is merely a rebound within an ongoing bear market. Our expectation is for the forthcoming decline in stocks to commence shortly, coinciding with the initiation of the next upward movement for commodities.
A pattern of two years of ascent followed by one year of descent implies that we still have twelve years remaining within the broader 15-year upcycle for commodities.
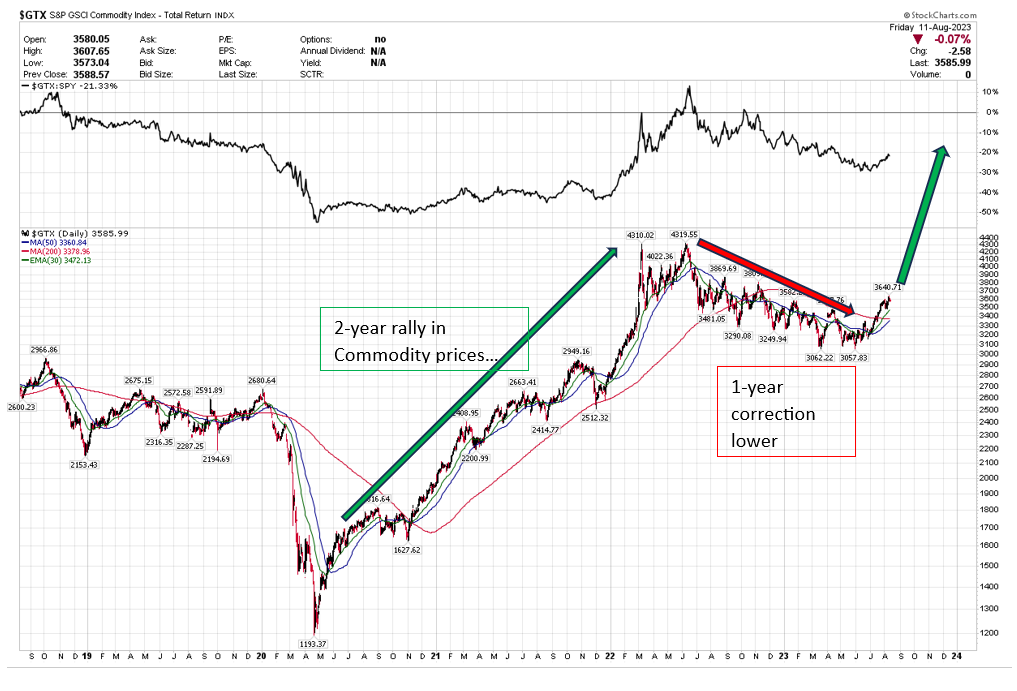
Illustration #4:
We anticipate that commodities will continue their upward cycle in line with their historical tendency for 15-year cycles of ascent and descent. However, what underpins the ongoing up cycle? We posit that the driving force is closely linked to the lack of investment in commodity supplies. The chart below illustrates that capital expenditures (CAPEX) by commodity companies are presently at historically low levels relative to the size of the economy (measured against GDP). In simple terms, if companies are not channeling investments into future supplies, a scenario of undersupply emerges over time. Consequently, this condition becomes conducive to significant price spikes as demand encounters scarcity. This, in our estimation, is precisely what will propel the next multi-year phase of heightened commodity prices.
It is important to note that peaks in commodity prices are usually accompanied by instances of over-investment (as indicated by the red arrows in the chart below), rather than the under-investment indicated by the green marker labeled "You are here!" We attribute this scenario to regulatory constraints and the global emphasis on "Clean/Green" initiatives, which have constrained exploration for future supply. Discovering new sources of commodities and transforming them into viable resources generally entails a timeframe of 10 to 15 years. This aspect further contributes to the recurring historical pattern of 15-year upcycles.
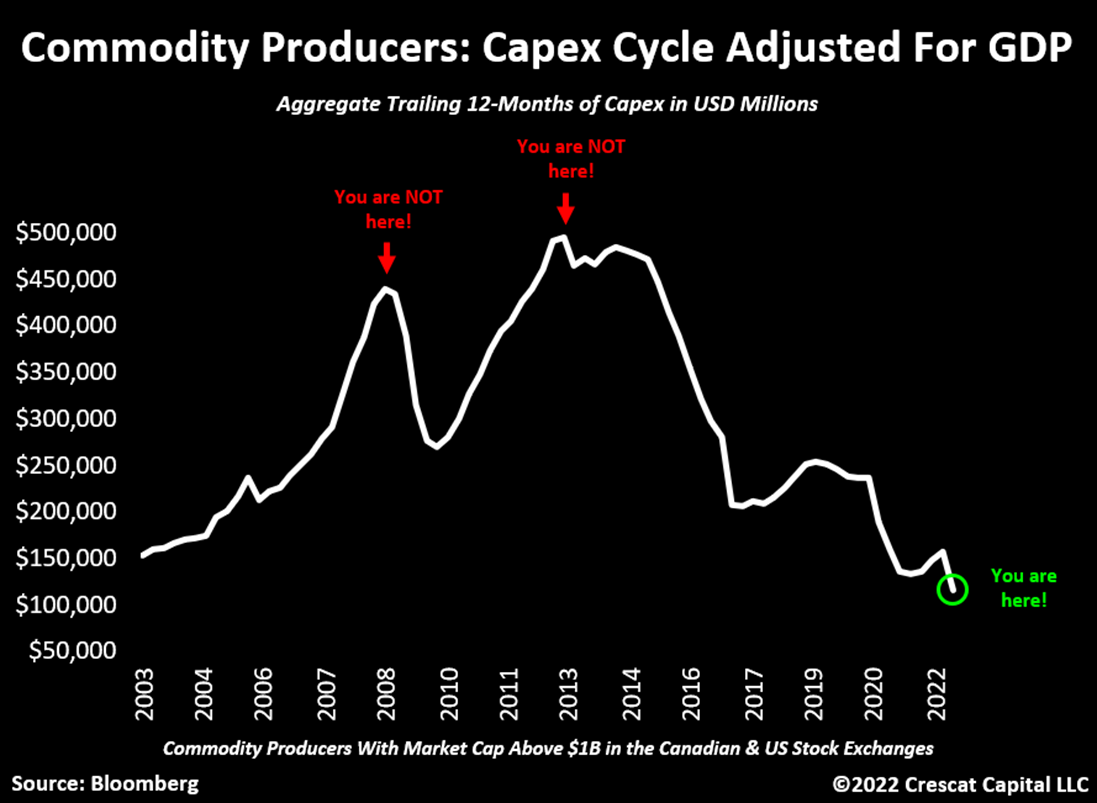
Illustration #5:
This chart illustrates the existing shortage of inventories for base metals. Base metals encompass commodities like iron ore, aluminum, and zinc. "Days to cover" refers to the number of days' worth of the commodity available in inventory. As of the close of 2022, our inventory of base metals amounted to less than 3 days' worth based on daily demand and usage metrics. Historically, such meager inventory levels have typically foreshadowed robust upward movements in the respective commodities, rather than sustained peaks in commodity prices. This scarcity of inventory is not exclusive to base metals alone. Similar shortages in inventory are observable in sectors such as oil/gas, precious metals, and agricultural products.
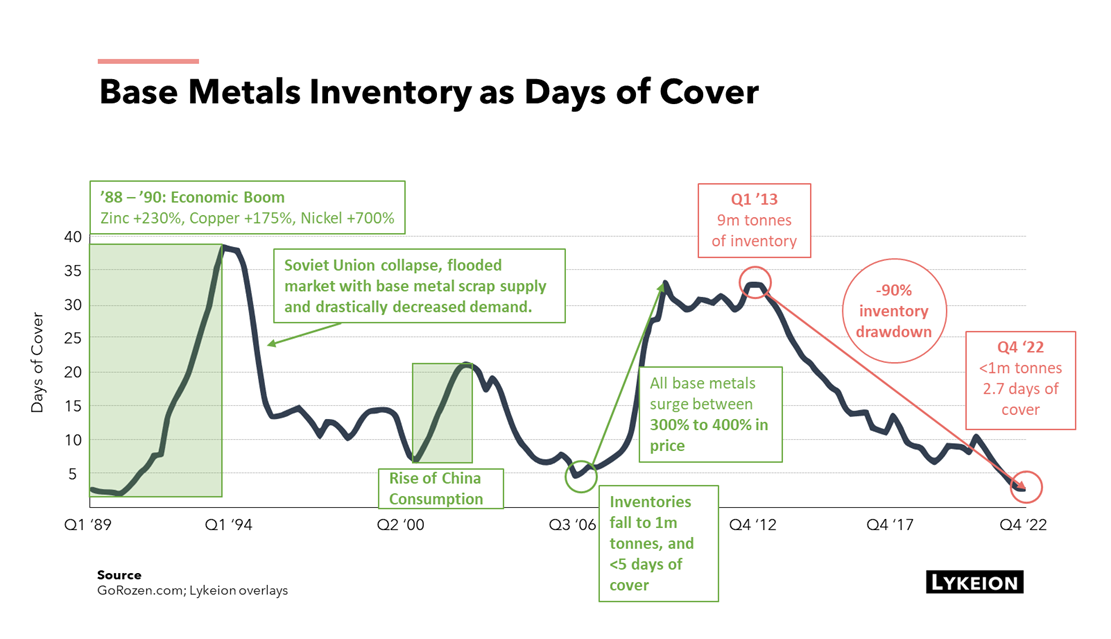
Illustration #6:
So, what implications does this hold for portfolios? As depicted below, in instances where the Consumer Price Index (CPI), a U.S. government measure of inflation, surpasses the norm, the conventional performance of stocks and bonds tends to lag behind the returns achieved by commodities, energy (oil & gas), and precious metals (gold & silver). We maintain the belief that for the foreseeable years, CPI will maintain a persistent presence and follow an upward trajectory. This solidifies our position on the ongoing commodity up cycle and our anticipated performance of commodities.
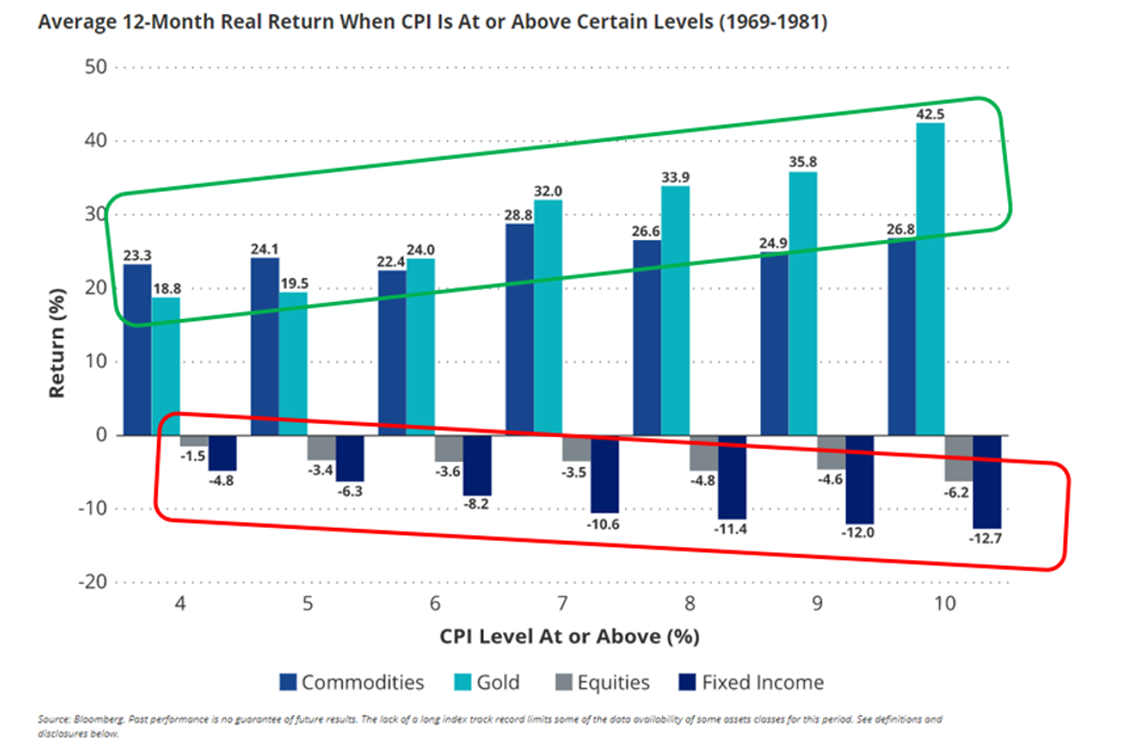
Illustration #7:
Periods of above-average inflation also commonly usher in phases of heightened volatility and subdued performance for the stock market as a whole. The subsequent chart illustrates the occurrences of "dead periods" wherein stocks yielded little to no returns over 12–15-year spans, such as the intervals from 1908 to 1922 and 1965 to 1981. Both of these epochs were characterized by elevated inflation rates during robust commodity up cycles.
We firmly believe that portfolios devoid of commodity exposure face a heightened risk of experiencing lackluster performance in the years ahead, especially in contrast to those with commodity exposure. It's worth considering: When you contemplate portfolio planning, how well would your overall strategy withstand the possibility of enduring a decade of dismal returns? The repercussions of such a scenario could have significantly detrimental effects, particularly for individuals nearing retirement or those who are already retired.

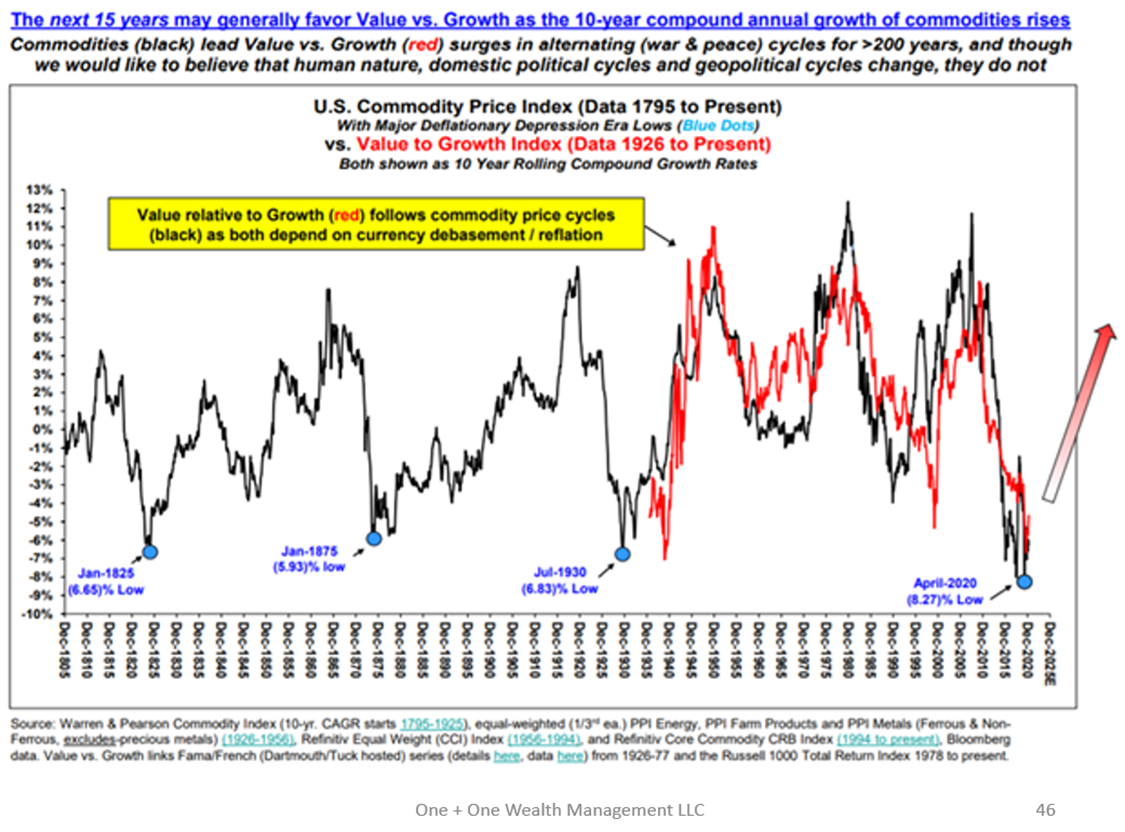
Illustration #8:
Lastly, it's noteworthy that commodity up cycles and down cycles tend to closely align with the outperformance and underperformance of value stocks compared to growth stocks. We hold a strong affinity for value stocks and hold a distinct aversion towards growth stocks, which have spearheaded market gains from 2009 to 2022. The remarkable surge in growth stocks during this period prompted investors to forsake their allocations to value stocks within their portfolios.
Coinciding with this, the downward cycle in commodities also led investors to relinquish their core allocations to commodities. Consequently, value stocks and commodity stocks find themselves significantly underrepresented in portfolios, while investors find themselves disproportionately invested in growth/technology stocks. This scenario sets the stage for the foundation of the strategy we are implementing within our client portfolios – an emphatic emphasis on value stocks and a substantial allocation to commodity stocks.
As you've seen, we're bullish on energy and commodities in general; however, this leads directly into our next “Why Series?” blog post covering “Why Value Stocks?”.
As always, please contact us to learn more and how we can help navigate and optimize your portfolios during today's market chaos. Additionally, let us know of specific topics of interest you'd like us to address.
Information presented is believed to be factual and up to date, but we do not guarantee its accuracy and it should not be regarded as a complete analysis of the subjects discussed. All expressions of opinion reflect the judgment of the authors as of the date of publication and are subject to change. Information on this website does not involve the rendering of personalized investment advice but is limited to the dissemination of general information on products and services. A professional adviser should be consulted before implementing any of the strategies presented. Content should not be construed as an offer to buy or sell, or a solicitation of any offer to buy or sell the securities mentioned herein. Hyperlinks on this website are provided as a convenience and we disclaim any responsibility for information, services or products found on websites linked hereto. One + One Wealth Management is registered as an investment adviser with the SEC and only transacts business in states where it is properly registered or is excluded or exempted from registration requirements. Registration as an investment adviser does not constitute an endorsement of the firm by securities regulators nor does it indicate that the adviser has attained a particular level of skill or ability.
Any tax and estate planning information provided is general in nature and should not be construed as legal or tax advice. Always consult an attorney or tax professional regarding your specific legal or tax situation. All investment strategies have the potential for profit or loss. Different types of investments involve varying degrees of risk, and there can be no assurance that any specific investment or strategy will be suitable or profitable for a client's investment portfolio.